Lexington's Urban Canopy
An exploration of canopy cover measures
Inspired by the Davey Resource Group's October 2013 study of canopy cover using 2012 NAIP imagery within Lexington's Urban Service Area, a GIS class at the University of Kentucky created a similar, though limited, evaluation.
We used 2014 NAIP imagery to create an NDVI image and field tested our canopy threshold at a NDVI value of 0.23. Our measurement was generally higher by 1%, since we did not remove areas with a high vegetative index, such as baseball fields, as was done by the Davey Resource Group.
Using zonal statistics on both canopy cover datasets, we counted the number of pixels classified as canopy cover by polygon features in parcels, landuse, and US Census blocks and block groups. We also looked at canopy rates per person via the 2010 census blocks and 2013 median home value.

18.3% of vacant land is under tree canopy, which yields over 1,600 acres of ecosystem services to the community. Single-family residential areas (35.5% canopy) account for 6,500 acres of canopy in the Urban Service Area.
Interactive Maps
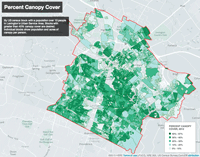
2012 Canopy Cover by Census Block
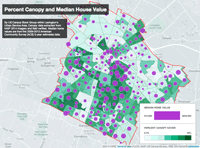
2014 Canopy Cover and Median Home Value
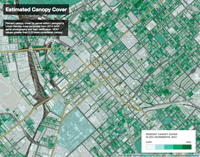
2014 Canopy Cover by Parcel
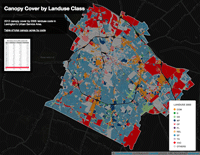
2012 Canopy Cover by Landuse Code